Historical Chicago Maps
Discover the maps that illustrate the growth of Chicago’s infrastructure.
Chicago is located on the traditional unceded homelands of the Council of the Three Fires: the Ojibwe, Odawa, and Potawatomi Nations. Many other tribes such as the Miami, Ho-Chunk, Menominee, Sac, and Fox also called this area home. The region has long been a center for Indigenous people to gather, trade, and maintain kinship ties. Today, one of the largest urban American Indian communities in the United States resides in Chicago. Members of this community continue to contribute to the life of this city and to celebrate their heritage, practice traditions, and care for the land and waterways.
- American Indian Center of Chicago
1804
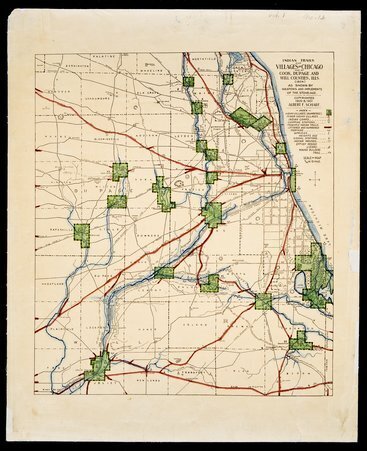
Scharf, Albert F. “Indian Trails and Villages of Chicago and of Cook, DuPage and Will Counties.” Map. 1901. Chicago History Museum, ICHi-029629
Albert Schraf’s map from 1804 depicts the various trails used by American Indians and the surrounding villages established by settlers. This year marked the completion of Fort Dearborn, which began construction a year prior.. Trails are highlighted in red, villages in green, and the major waterways in blue. Many of these prominent trails would later be appropriated by settlers to establish the network of roads used in Illinois up until the Great Fire of 1871.
(Source: Chicago History Museum)

1812
NA. “Map of Chicago in 1812.” Map. 1812. Newberry Library
Depicting the surrounding area of Fort Dearborn, one can see the homes occupied by soldiers, merchants, factory workers, and armorers. At this point, American Indians were being forced from their ancestral lands and pushed outside the parameters of this map. This was one of many causes that led to the Battle of Fort Dearborn. The Potawatomi people emerged as victors and Fort Dearborn was subsequently burned down.
(Source: Newberry Library)
1835
NA. “Map of Chicago, 1835.” Map. 1835. Newberry Library
Two years after being incorporated as a town, American settlers are beginning to establish larger, permanent plots of land for residency. This map displays the 1835 additions to the original 1830 subdivision located south of Kinzie Street. It was commissioned by the Illinois and Michigan Canal commissioners.


1836
NA. “Map of Chicago and Additions, 1836.” Map. 1836. Chicago Historical Society, ICHi-37310
The expansion of Chicago’s infrastructure continues, as these additions cover more of the prairie land. This map served as a mandate for Lake Front Park, declaring that it shall forever remain free of any buildings or obstructions. Chicago would go on to be incorporated as a city in the following year.
1857
Palmatary, J. T. Inger, Christian. Herline & Hensel. and Braunhold & Sonne. “Chicago”. Lithograph. 1857. Library of Congress Geography and Map Division, G4104.C6A3
This perspective lithographic map was notably not drawn to scale, but depicts the lively atmosphere of Downtown Chicago in the mid-19th century. This year marked the opening of Chicago’s oldest family-owned business, Iwan Ries & Co.


1871
NA. “Map of Chicago Showing the Burnt District.” Map. 1971. Norman B. Leventhal Map Center, G4104.C6
After the Great Chicago Fire of 1871, city officials sought quick action in analyzing the scope of damage that occurred within the city. The fire consumed over 3 square miles, beginning in the southwest region of the city and spreading upwards into the northern side. This resulted in the loss of roughly 73 miles of road and 17,500 buildings, as well as the death of roughly 300 people.
1874
Currier and Ives. “View of Chicago before the Great Chicago Fire.” Lithograph. 1870-1879. Chicago History Museum, ICHi-021375
Currier and Ives’ were commissioned to illustrate the landscape of Chicago prior to the fire of 1871. It was republished in 1892 to promote Chicago’s as the host of thee World’s Fair in 1893. Great detail was taken to emphasize the mouth of the canal and the many ships that occupied it.


1886
Rand McNally & Co. “Chicago Map.” Map. 1886. Chicago History Museum, ICHi-031337
Rand McNally’s 1886 depiction of Chicago includes the many boulevards, public parks, and lake front properties that were re-established after the fire. This was the year that the notable Haymarket Affair occurred. These were peaceful worker’s rights protest that broke out into a riot after a dynamite bomb was discharged during a conflict with the police..
1896
Carqueville Litho. Co. “Map of Chicago Showing Water Works System, Parks, Boulevards, and Railroads.” Map. 1896. Chicago History Museum, ICHi-176292
This lithograph was used by the City Map Department to illustrate the sprawling water works system within the city. It also gives a more expansive view of the various parks and boulevards making up Chicago’s infrastructure.


1918
Robertson, John Dill. “A Report on an Epidemic of Influenza in the City of Chicago in the Fall of 1918.” Map. 1918. Chicago History Museum, ICHi-176187
Included as an illustration from an educational series, this map surveys the impact of the 1918 pandemic within the city. It records the 1,499 influenza and 789 pneumonia deaths for the week beginning October 20. Roughly 8,500 Chicagoans would go on to lose their lives from the pandemic, which lasted until 1920.
1939
Hedrich-Blessing. “Population Density Map of Chicago, Illinois.” Map. 1943. Chicago History Museum, Hedrich-Blessing Collection, HB-07399-A
Hedrich-Blessing captures the population density of Chicago in the year 1939.

1943
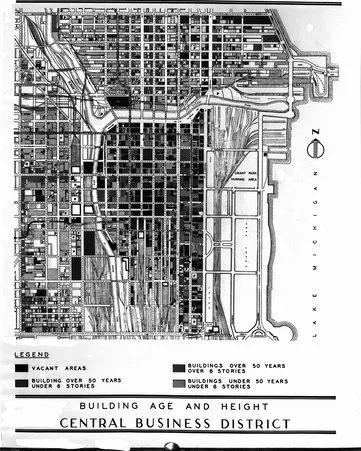
Hedrich-Blessing. “Building Age and Height Map of Chicago, Illinois.” Map. 1943. Chicago History Museum, Hedrich-Blessing Collection, HB-07399-C
The height and age of buildings within the Central Business District are recorded here. At the time, the Chicago Board of Trade Building was considered the tallest building in the city at 604-feet. This ahs since been surpassed by the 1,450-foot Willis Tower.
Research assembled by Clayton Kennedy